March 2024 Greater Vancouver Realtors Statistics
1. Areas covered by the Real Estate Board of Greater Vancouver include: Burnaby, Coquitlam, Maple Ridge, New Westminster, North Vancouver, Pitt…

1. Areas covered by the Real Estate Board of Greater Vancouver include: Burnaby, Coquitlam, Maple Ridge, New Westminster, North Vancouver, Pitt…
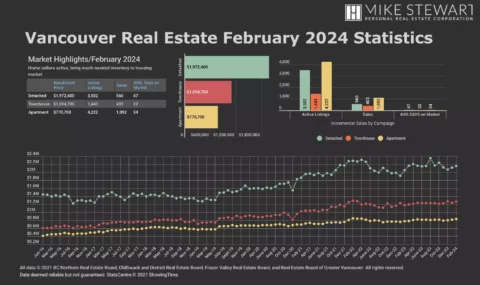
Home sellers active, bring much-needed inventory to housing market – February 2024 Greater Vancouver Realtors Statistics 1. Areas covered by the…
Home sales across Metro Vancouver’s housing market off to strong start in 2024 – January 2024 Real Estate Board of Greater…
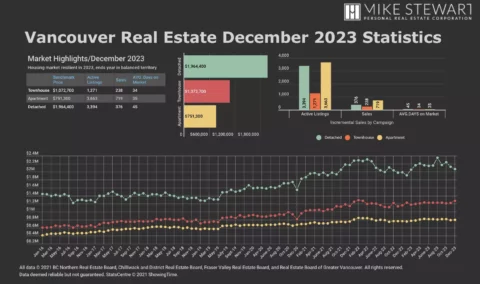
December 2023 Real Estate Board of Greater Vancouver Statistics – Housing market resilient in 2023, ends year in balanced territory VANCOUVER,…
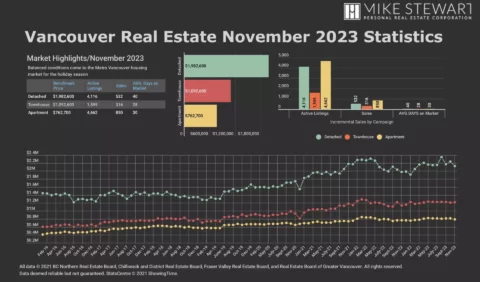
November 2023 Real Estate Board of Greater Vancouver Statistics – Balanced conditions come to the Metro Vancouver housing market for the…
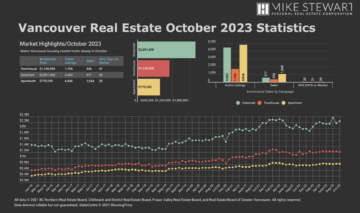
October 2023 Real Estate Board of Greater Vancouver Statistics – Metro Vancouver housing market holds steady in October VANCOUVER, BC –…
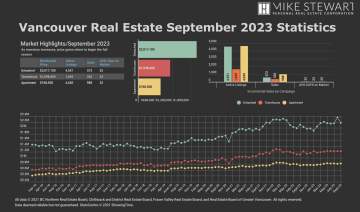
September 2023 Real Estate Board of Greater Vancouver Statistics – Seasonal slowdown brings price stability to Metro Vancouver VANCOUVER, BC…
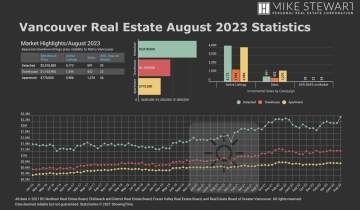
August 2023 Real Estate Board of Greater Vancouver Statistics – the Real Estate Board of Greater Vancouver (REBGV) provided a monthly market…
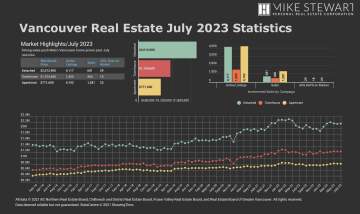
REBGV’s July 2023 Market Insights Home prices across all home types in Metro Vancouver experienced a rise in July, with strong sales…
Competition heats up among buyers as summer arrives While the year started slower than usual, Metro Vancouver’s1 housing market is showing signs…
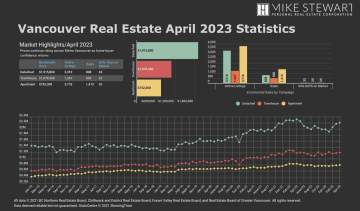
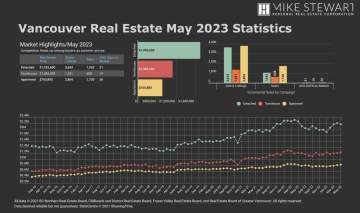
Prices continue rising across Metro Vancouver as home buyer confidence returns VANCOUVER, BC – May 2, 2023 – With listing activity…
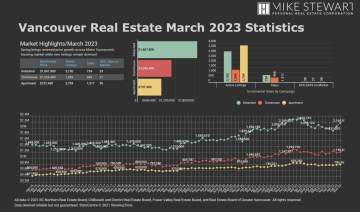
Spring brings renewed price growth across Metro Vancouver’s housing market while new listings remain dormant VANCOUVER, BC – April 3, 2023…
That's All! Stay tuned for more.
That's All! Stay tuned for more.