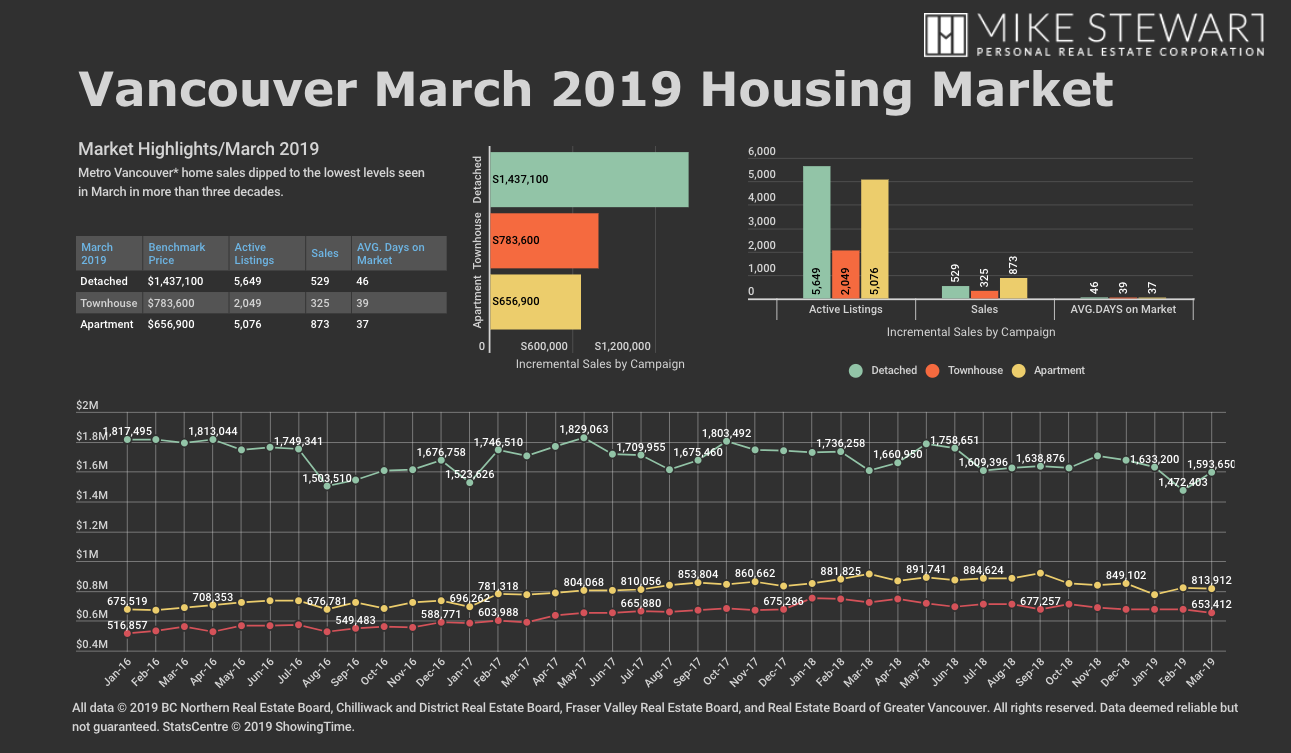
Metro Vancouver* home sales dipped to the lowest levels seen in March in more than three decades.
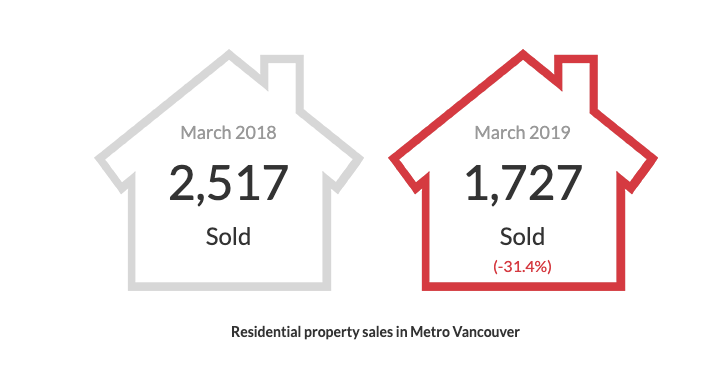
The Real Estate Board of Greater Vancouver (REBGV) reports that residential home sales in the region totalled 1,727 in March 2019, a 31.4 per cent decrease from the 2,517 sales recorded in March 2018, and a 16.4 per cent increase from the 1,484 homes sold in February 2019.
Last month’s sales were 46.3 per cent below the 10-year March sales average and was the lowest total for the month since 1986.
“Housing demand today isn’t aligning with our growing economy and low unemployment rates. The market trends we’re seeing are largely policy induced. For three years, governments at all levels have imposed new taxes and borrowing requirements on to the housing market.” Ashley Smith, REBGV president.
“What policymakers are failing to recognize is that demand-side measures don’t eliminate demand, they sideline potential home buyers in the short term. That demand is ultimately satisfied down the line because shelter needs don’t go away. Using public policy to delay local demand in the housing market just feeds disruptive cycles that have been so well-documented in our region.”
There were 4,949 detached, attached and apartment properties newly listed for sale on the Multiple Listing Service® (MLS®) in Metro Vancouver in March 2019. This represents an 11.2 per cent increase compared to the 4,450 homes listed in March 2018 and a 27.2 per cent increase compared to February 2019 when 3,892 homes were listed.
The total number of homes currently listed for sale on the MLS® system in Metro Vancouver is 12,774, a 52.4 per cent increase compared to March 2018 (8,380) and a 10.2 per cent increase compared to February 2019 (11,590).
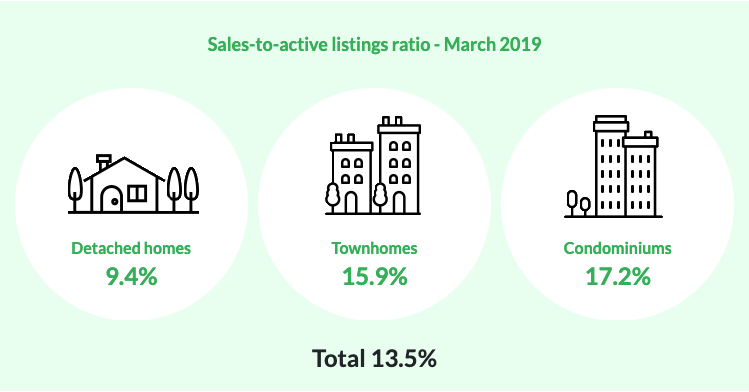
For all property types, the sales-to-active listings ratio for March 2019 is 13.5 per cent.
Generally, analysts say downward pressure on home prices occurs when the ratio dips below 12 per cent for a sustained period, while home prices often experience upward pressure when it surpasses 20 per cent over several months.
The MLS® Home Price Index composite benchmark price for all residential properties in Metro Vancouver is currently $1,011,200. This represents a 7.7 per cent decrease from March 2018, and a 0.5 per cent decrease compared to February 2019.
Sales of detached homes in March 2019 reached 529, a 26.7 per cent decrease from the 722 sales in March 2018. The benchmark price for a detached home is $1,437,100. This represents a 10.5 per cent decrease from March 2018, and a 0.4 per cent decrease compared to February 2019.
Sales of apartment homes reached 873 in March 2019, a 35.3 per cent decrease compared to the 1,349 sales in March 2018. The benchmark price of an apartment property is $656,900. This represents a 5.9 per cent decrease from March 2018, and a 0.5 per cent decrease compared to February 2019.
Attached home sales in March 2019 totalled 325, a 27.1 per cent decrease compared to the 446 sales in March 2018. The benchmark price of an attached home is $783,600. This represents a six per cent decrease from March 2018, and a 0.7 per cent decrease compared to February 2019.