Below average home sales allow inventory to inch upwards
VANCOUVER, BC – March 2, 2023 – February listing data show a continued reluctance among prospective home sellers to engage in Metro Vancouver’s* housing market, leading to below-average sales activity. With sales remaining well-below historical norms, the number of available homes for sale in the region have continued inching upwards.
The Real Estate Board of Greater Vancouver (REBGV) reports that residential home sales in the region totalled 1,808 in February 2023, a 47.2 per cent decrease from the 3,424 sales recorded in February 2022, and a 76.9 per cent increase from the 1,022 homes sold in January 2023.
Last month’s sales were 33 per cent below the 10-year February sales average.
“It’s hard to sell what you don’t have, and with new listing activity remaining among the lowest in recent history, sales are struggling to hit typical levels for this point in the year,” said Andrew Lis, REBGV’s director, economics and data analytics. “On the plus side for prospective buyers, the below-average sales activity is allowing inventory to accumulate, which is keeping market conditions from straying too deeply into sellers’ market territory, particularly in the more affordably priced segments.”
There were 3,467 detached, attached and apartment properties newly listed for sale on the Multiple Listing Service® (MLS®) in Metro Vancouver in February 2023. This represents a 36.6 per cent decrease compared to the 5,471 homes listed in February 2022 and a 5.2 per cent increase compared to January 2023 when 3,297 homes were listed.
The total number of homes currently listed for sale on the MLS® system in Metro Vancouver is 7,868, a 16.7 per cent increase compared to February 2022 (6,742) and a 5.2 per cent increase compared to January 2023 (7,478).
“While we continue to expect home price trends to show year-over-year declines for a few more months, current data and market activity suggest pricing is firming up. In fact, some leading indicators suggest we may see modest price increases this spring, particularly if sales activity increases and mortgage rates hold steady,” Lis said. “In the somewhat unusual market environment we find ourselves in right now with higher mortgage rates, fewer sales, and inventory that is inching higher but remains far from abundant, working with a Realtor who understands your local market conditions and has experience navigating challenging markets is paramount.”
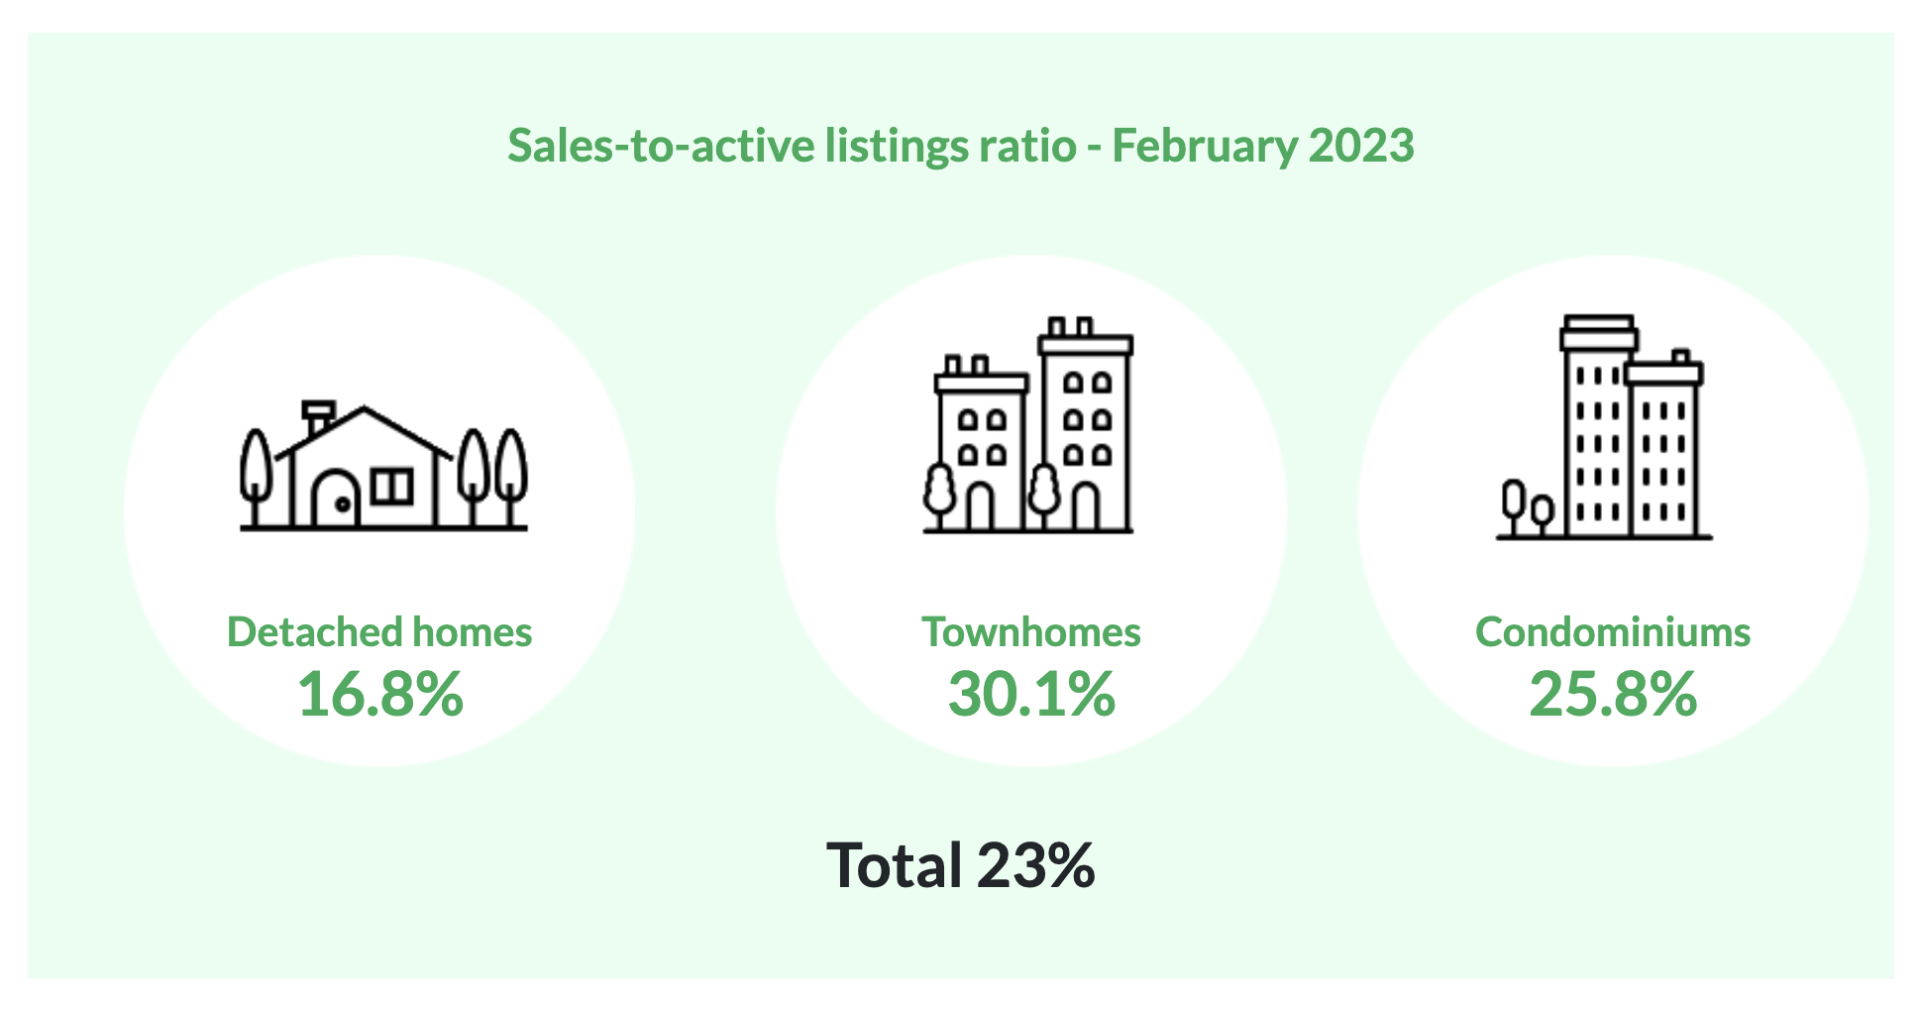
For all property types, the sales-to-active listings ratio for February 2023 is 23 per cent. By property type, the ratio is 16.8 per cent for detached homes, 30.1 per cent for townhomes, and 25.8 per cent for apartments.
Generally, analysts say downward pressure on home prices occurs when the ratio dips below 12 per cent for a sustained period, while home prices often experience upward pressure when it surpasses 20 per cent over several months.
The MLS® Home Price Index composite benchmark price for all residential properties in Metro Vancouver is currently $1,123,400. This represents a 9.3 per cent decrease over February 2022 and a 1.1 per cent increase compared to January 2023.
Sales of detached homes in February 2023 reached 514, a 49.1 per cent decrease from the 1,010 detached sales recorded in February 2022. The benchmark price for detached properties is $1,813,100. This represents a 12 per cent decrease from February 2022 and a 0.7 per cent increase compared to January 2023.
Sales of apartment homes reached 928 in February 2023, a 49.9 per cent decrease compared to the 1,854 sales in February 2022. The benchmark price of an apartment property is $732,200. This represents a three per cent decrease from February 2022 and a 1.6 per cent increase compared to January 2023.
Attached home sales in February 2023 totalled 366, a 34.6 per cent decrease compared to the 560 sales in February 2022. The benchmark price of an attached unit is $1,038,500. This represents a 6.3 per cent decrease from February 2022 and a 1.8 per cent increase compared to January 2023.
1. Areas covered by the Real Estate Board of Greater Vancouver include: Burnaby, Coquitlam, Maple Ridge, New Westminster, North Vancouver, Pitt Meadows, Port Coquitlam, Port Moody, Richmond, South Delta, Squamish, Sunshine Coast, Vancouver, West Vancouver, and Whistler.


