REBGV’s July 2023 Market Insights
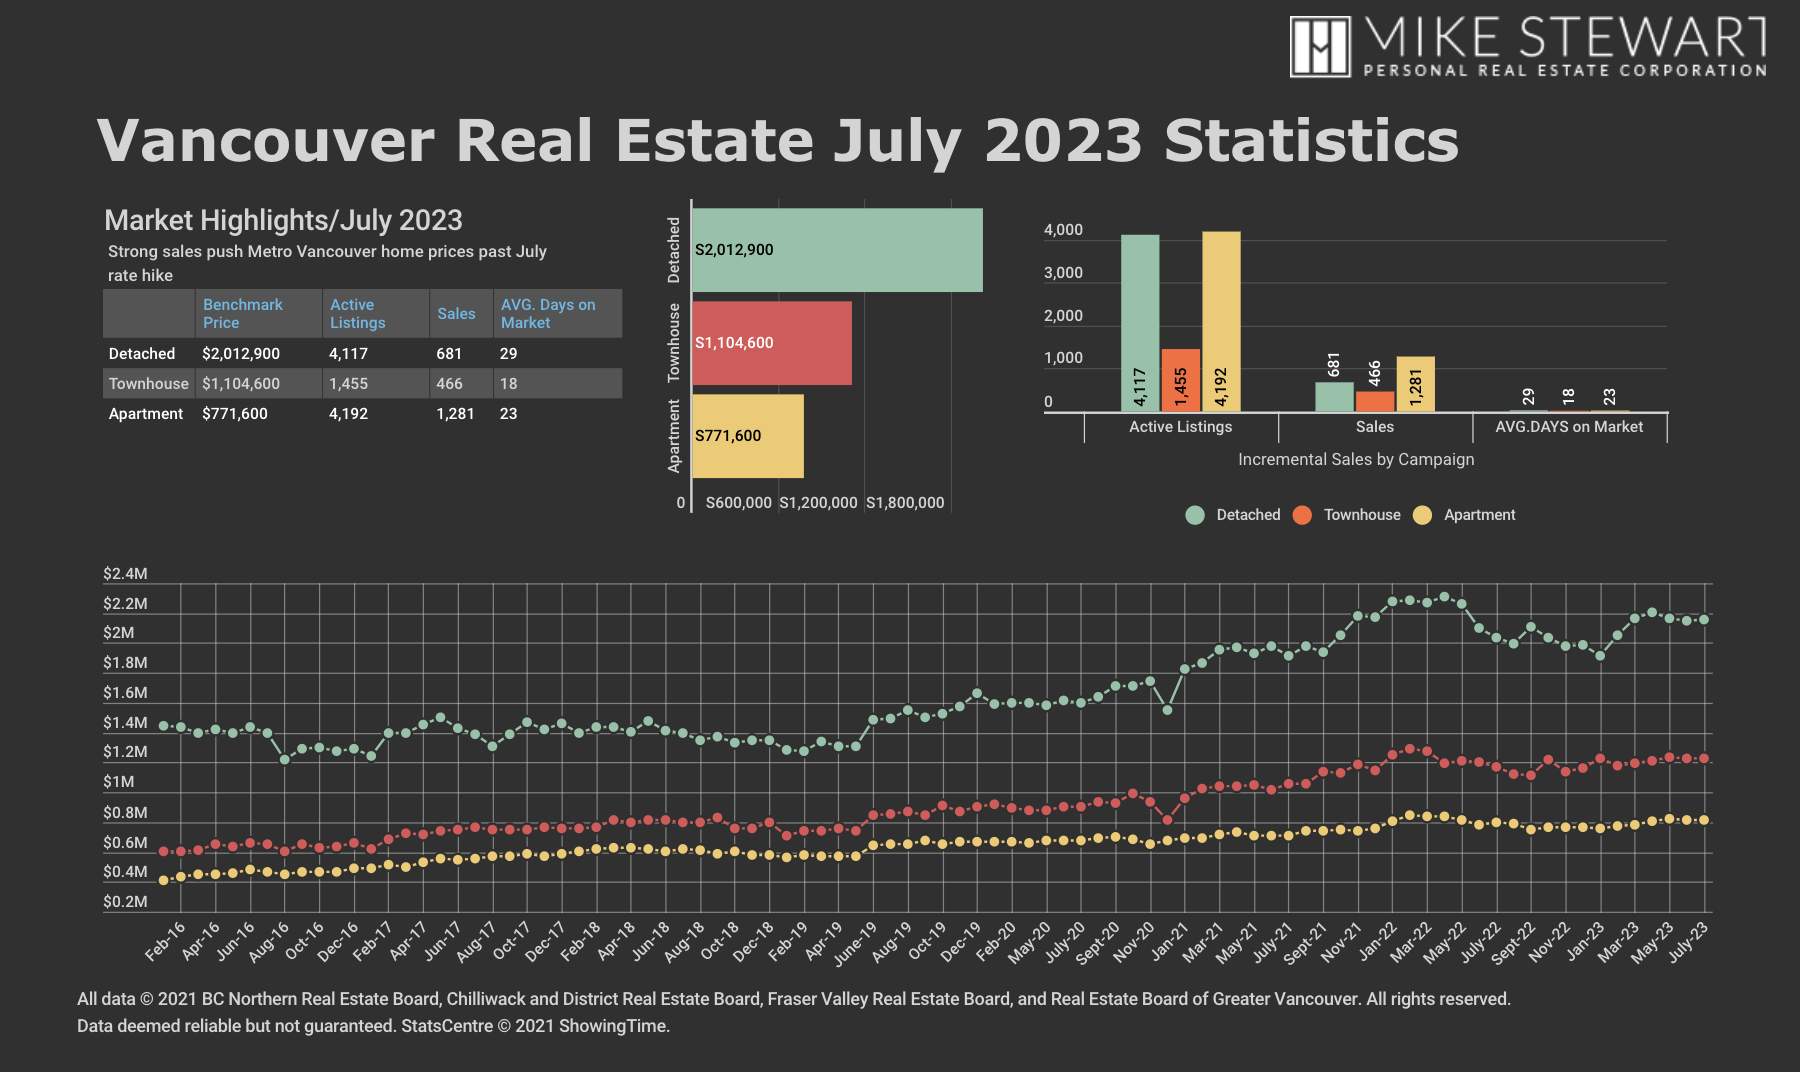
Home prices across all home types in Metro Vancouver experienced a rise in July, with strong sales figures continuing to challenge the low levels of housing inventory.Overview of Metro Vancouver’s Housing Market
Despite reaching 10-year highs in mortgage rates, the demand in Metro Vancouver’s housing market remains robust. In July, approximately 2,500 homes were sold on the MLS, marking a 29% increase from the previous year. This surge is noteworthy, especially considering that the previous July was when the Bank of Canada announced a one percent hike to the policy rate, which took many buyers and sellers by surprise, subsequently cooling the market activity.Supply Dynamics
On the supply front, sellers listed around 4,600 homes on the MLS in July, a 17% rise compared to the same period last year. However, this figure is still 5% below the 10-year average for new listings in July. The month concluded with approximately 10,300 homes available for sale on the MLS across the region, a 4% drop from the previous year and 14% below the 10-year seasonal average.Understanding the Sales to Active Listings Ratio
The sales to active listings ratio is a crucial metric used to assess supply and demand in the market. This ratio compares the number of homes available for sale against the number of homes sold throughout the month. Historical data analysis indicates that when this ratio consistently falls below 12%, there’s a downward pressure on home prices. Conversely, home prices often face upward pressure when the ratio exceeds 20% over several months. For July, the ratio stood at 25% for all homes. Breaking it down by property type:-
- Detached homes: 17%
-
- Townhomes: 32%
-
- Condos: 31%
Price Benchmarks for July
The composite MLS HPI Benchmark price for all housing types in Metro Vancouver for July was $1,210,000, marking a 0.5% increase from the previous year and a 0.6% rise from the preceding month. Here’s a breakdown by property type:-
- Detached homes: $2,012,000
-
- Townhomes: $1,104,000
-
- Apartments: $771,000
Further Information
For more detailed housing market insights, visit the market watch section of the REBGV website.July 2023 Real Estate Board of Greater Vancouver Statistics – Strong sales push Metro Vancouver home prices past the rate hike in July
VANCOUVER, BC – August 2, 2023 – Home prices across all home types in Metro Vancouver rose again in July, as strong sales figures continue to push up against low levels of housing inventory in the region. The Real Estate Board of Greater Vancouver (REBGV) reports that residential home sales in the region totalled 2,455 in July 2023, a 28.9 per cent increase from the 1,904 sales recorded in July 2022. This was 15.6 per cent below the 10-year seasonal average (2,909). “While sales remain about 15 per cent below the ten-year average, they are also up about 30 per cent year-over-year, which is not insignificant,” Andrew Lis, REBGV’s director of economics and data analytics said. “Looking under the hood of these figures, it’s easy to see why sales are posting such a large year-over-year percentage increase. Last July marked the point when the Bank of Canada announced their ‘super-sized’ increase to the policy rate of one full per cent, catching buyers and sellers off guard, and putting a chill on market activity at that time.” There were 4,649 detached, attached and apartment properties newly listed for sale on the Multiple Listing Service® (MLS®) in Metro Vancouver in July 2023. This represents a 17 per cent increase compared to the 3,975 homes listed in July 2022. This was 5.2 per cent below the 10-year seasonal average (4,902). The total number of homes currently listed for sale on the MLS® system in Metro Vancouver is 10,301, a four per cent decrease compared to July 2022 (10,734). This was 14.4 per cent below the 10-year seasonal average (12,039). Across all detached, attached and apartment property types, the sales-to-active listings ratio for July 2023 is 24.9 per cent. By property type, the ratio is 16.5 per cent for detached homes, 32 per cent for townhomes, and 30.6 per cent for apartments. Analysis of the historical data suggests downward pressure on home prices occurs when the ratio dips below 12 per cent for a sustained period, while home prices often experience upward pressure when it surpasses 20 per cent over several months. “What’s interesting to see in the current market environment is that, while the Bank of Canada rate hike this July was only a quarter of a per cent, mortgage rates are now at the highest levels we’ve seen in Canada in over ten years,” Lis said. “Yet despite borrowing costs being even higher than last July, sales activity surpassed the levels we saw last year, which I think says a lot about the strength of demand in our market and buyers’ ability to adapt to and qualify for higher borrowing costs.” The MLS® Home Price Index composite benchmark price for all residential properties in Metro Vancouver is currently $1,210,700. This represents a 0.5 per cent increase over July 2022 and a 0.6 per cent increase compared to June 2023. Sales of detached homes in July 2023 reached 681, a 28.7 per cent increase from the 529 detached sales in July 2022. The benchmark price for a detached home is $2,012,900. This represents a 0.6 per cent increase from July 2022 and a 1.1 per cent increase compared to June 2023. Sales of apartment homes reached 1,281 in July 2023, a 20.7 per cent increase compared to the 1,061 sales in July 2022. The benchmark price of an apartment home is $771,600. This represents a 2.6 per cent increase from July 2022 and a 0.6 per cent increase compared to June 2023. Attached home sales in July 2023 totalled 466, a 53.3 per cent increase compared to the 304 sales in July 2022. The benchmark price of an attached home is $1,104,600. This represents a 1.2 per cent increase from July 2022 and a 0.5 per cent increase compared to June 2023.
1. Areas covered by the Real Estate Board of Greater Vancouver include: Burnaby, Coquitlam, Maple Ridge, New Westminster, North Vancouver, Pitt Meadows, Port Coquitlam, Port Moody, Richmond, South Delta, Squamish, Sunshine Coast, Vancouver, West Vancouver, and Whistler.