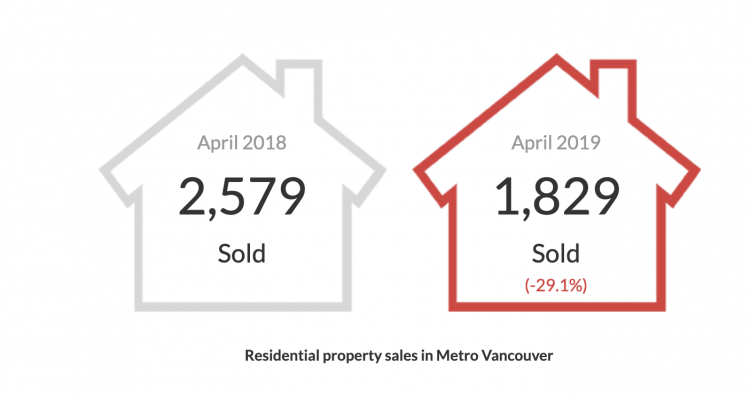
Decreased demand continues to allow the supply of homes for sale to accumulate across the Metro Vancouver* housing market.The Real Estate Board of Greater Vancouver (REBGV) reports that residential home sales in the region totalled 1,829 in April 2019, a 29.1 per cent decrease from the 2,579 sales recorded in April 2018, and a 5.9 per cent increase from the 1,727 homes sold in March 2019.Last month’s sales were 43.1 per cent below the 10-year April sales average.
“Government policy continues to hinder home sale activity. The federal government’s mortgage stress test has reduced buyers’ purchasing power by about 20 per cent, which is causing people at the entry-level side of the market to struggle to secure financing,” Ashley Smith, REBGV president said. “Suppressing housing activity through government policy not only reduces home sales, it harms the job market, economic growth and creates pent-up demand.”
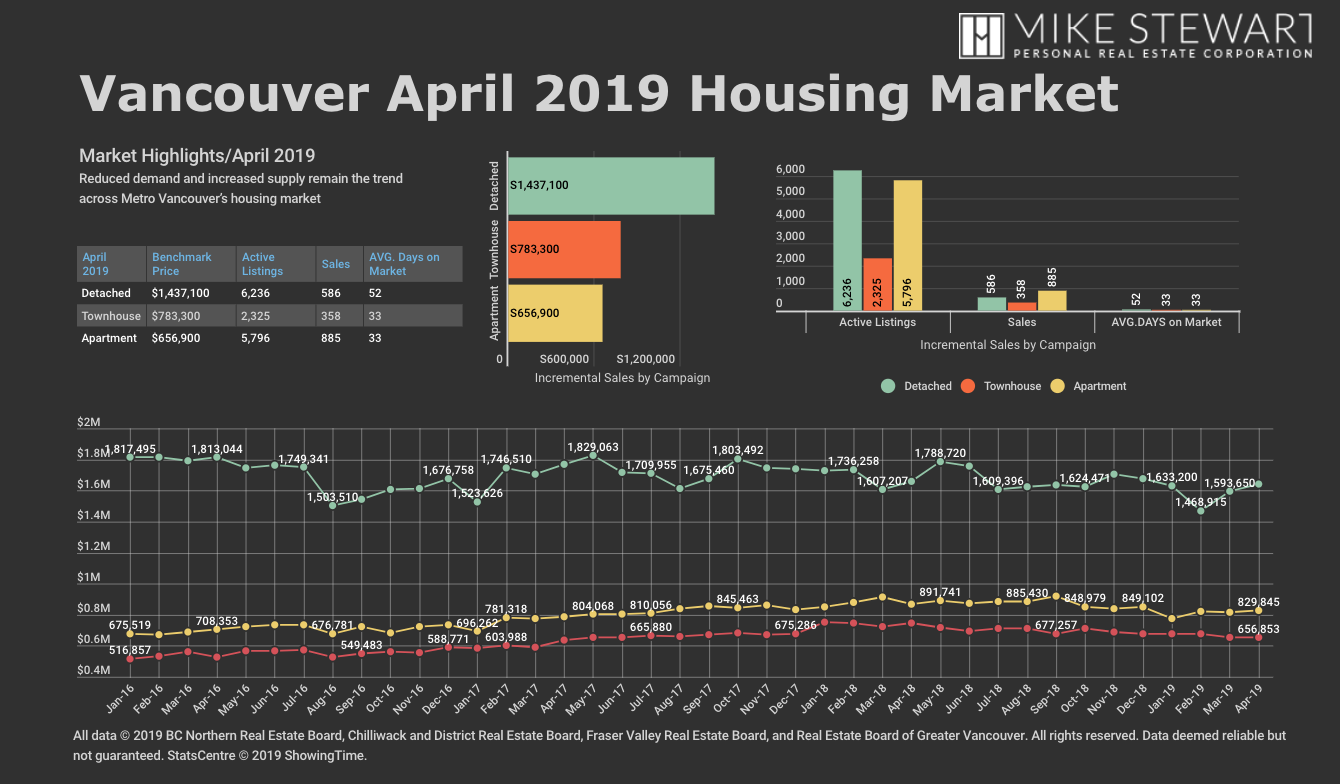
There were 5,742 detached, attached and apartment properties newly listed for sale on the Multiple Listing Service® (MLS®) in Metro Vancouver in April 2019. This represents a 1.3 percent decrease compared to the 5,820 homes listed in April 2018 and a 16 per cent increase compared to March 2019 when 4,949 homes were listed.
The total number of homes currently listed for sale on the MLS® in Metro Vancouver is 14,357, a 46.2 per cent increase compared to April 2018 (9,822) and a 12.4 per cent increase compared to March 2019 (12,774).
“There are more homes for sale in our market today than we’ve seen since October 2014. This trend is more about reduced demand than increased supply,” Smith said. “The number of new listings coming on the market each month are consistent with our long-term averages. It’s the reduced sales activity that’s allowing listings to accumulate.”
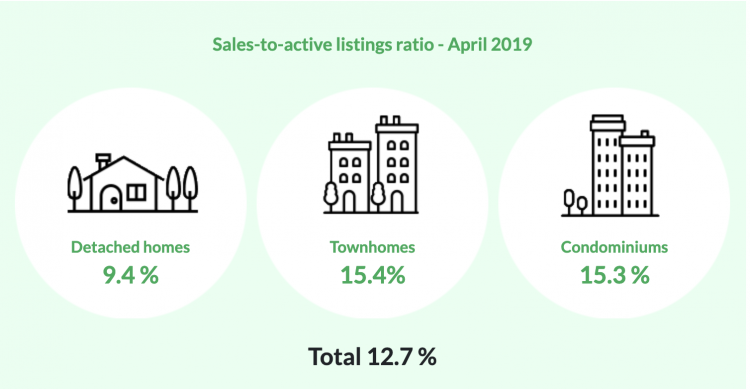
The overall sales-to-active listings ratio for April 2019 is 12.7 per cent. By property type, the ratio is 9.4 per cent for detached homes, 15.4 per cent for townhomes, and 15.3 per cent for apartments.
Generally, analysts say downward pressure on home prices occurs when the ratio dips below 12 per cent for a sustained period, while home prices often experience upward pressure when it surpasses 20 per cent over several months.
The MLS® Home Price Index composite benchmark price for all residential properties in Metro Vancouver is currently $1,008,400. This represents an 8.5 per cent decrease over April 2018, and a 0.3 per cent decrease compared to March 2019.
Detached home sales totalled 586 in April 2019, a 27.4 per cent decrease from the 807 detached sales in April 2018. The benchmark price for a detached home is $1,425,200. This represents an 11.1 per cent decrease from April 2018, a 0.8 per cent decrease compared to March 2019.
Apartment home sales totalled 885 in April 2019, a 32.3 per cent decrease compared to the 1,308 sales in April 2018. The benchmark price of an apartment is $656,900 in the region. This represents a 6.9 per cent decrease from April 2018 and is unchanged from March 2019.
Attached home sales totalled 358 in April 2019, a 22.8 per cent decrease compared to the 464 sales in April 2018. The benchmark price of an attached home is $783,300. This represents a 7.5 per cent decrease from April 2018 and is unchanged from March 2019.
*Areas covered by the Real Estate Board of Greater Vancouver include: Burnaby, Coquitlam, Maple Ridge, New Westminster, North Vancouver, Pitt Meadows, Port Coquitlam, Port Moody, Richmond, South Delta, Squamish, Sunshine Coast, Vancouver, West Vancouver, and Whistler.
Wow I can’t believe some of those numbers! My dream to one day have a place in West Vancouver is slowly fading away! HA! Great write up, we find these reports helpful out here in Saskatchewan. Thanks for sharing! Keep up the great work!
Julian
My pleasure Julian! Let us know what we can do to help.
Thanks!